
How to Read a Commercial Utility Bill: Demand Charges, Consumption, and What Your Bill Reveals About Your Building
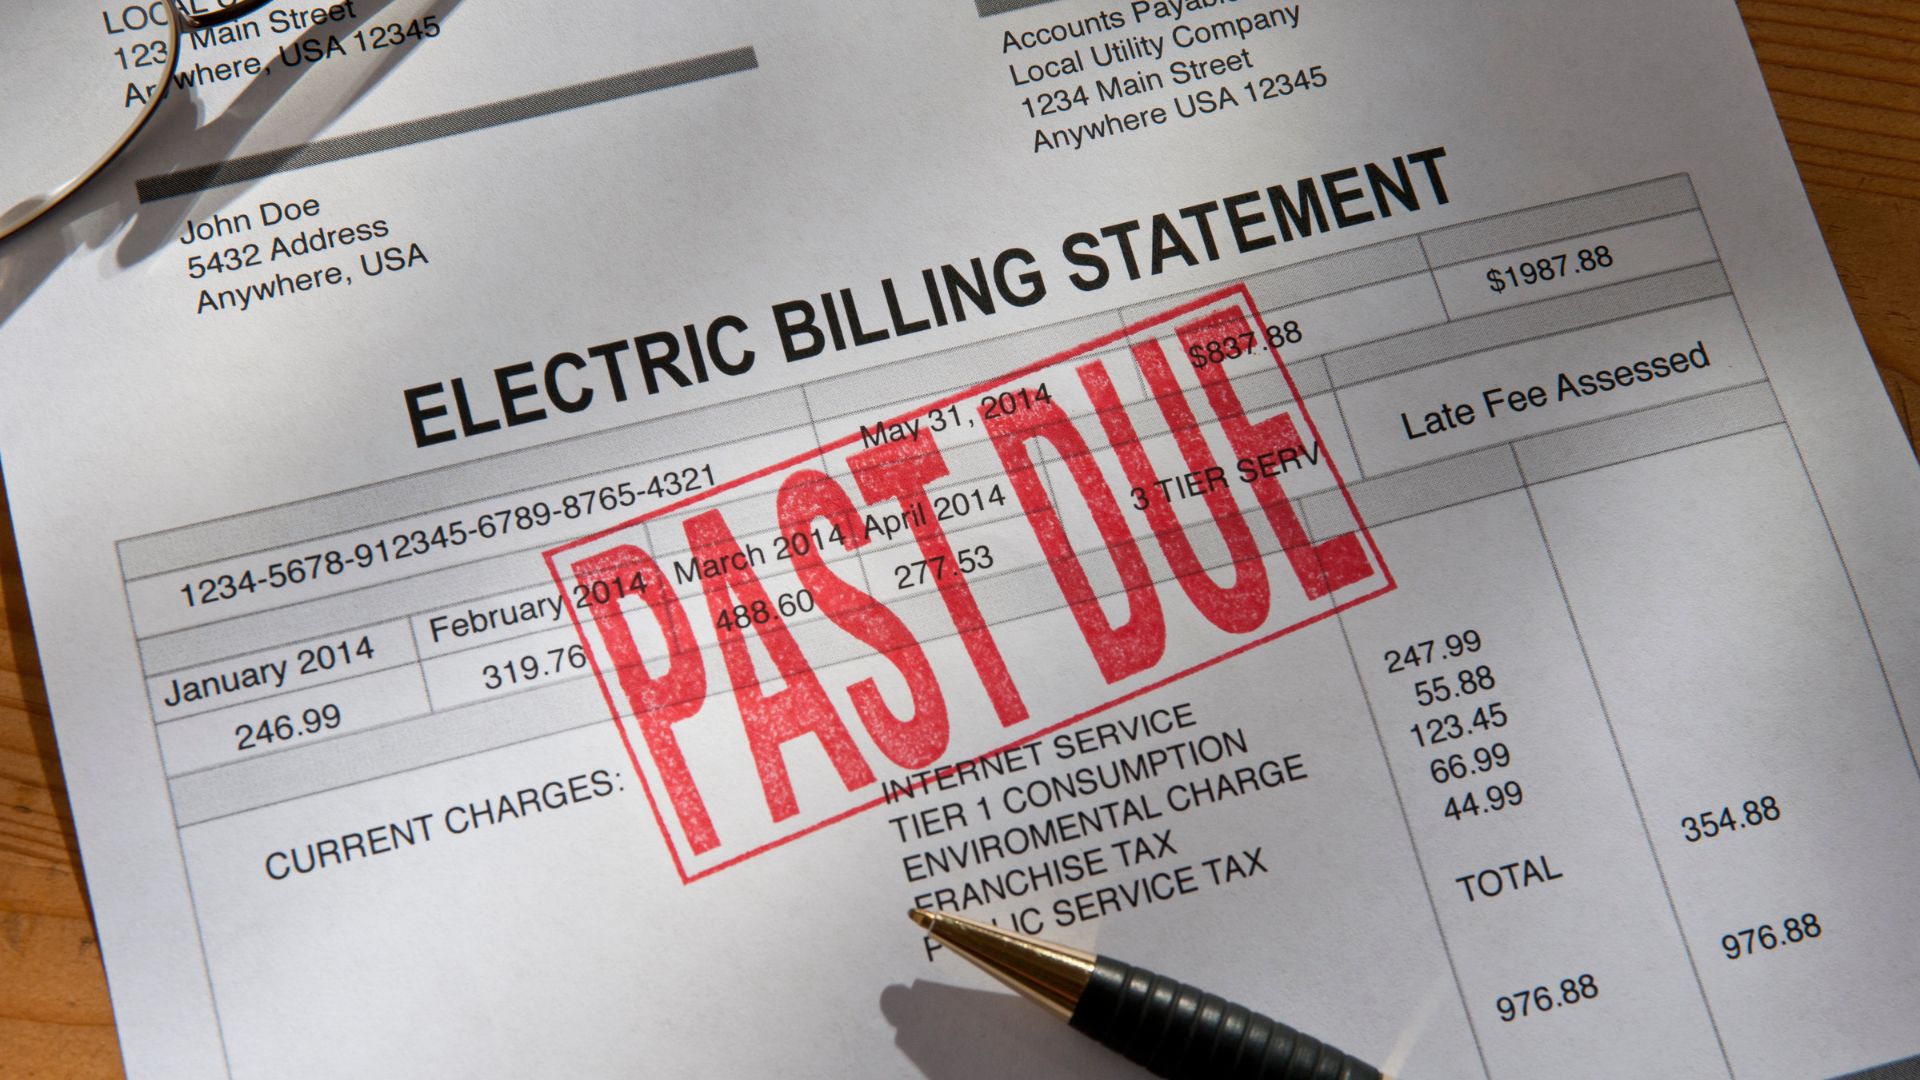
Your utility bill is one of the most consistent sources of building data you have. It arrives every month, it reflects real operations, and it often goes straight to accounts payable without anyone reading it closely.
That is a missed opportunity. Commercial buildings account for roughly 17% of total U.S. energy consumption, according to the U.S. Energy Information Administration (EIA), and for individual owners, energy is often one of the more controllable operating expenses.
This guide walks through how to read a commercial electric bill, what the main charges mean, and what patterns to look for. Utilities and rate structures vary, so treat this as a framework and confirm the details with your own utility and rate schedule.
Why Your Bill Deserves a Closer Look
A rising bill does not always mean the building is wasting energy. Weather, occupancy changes, new tenants, and rate changes all play a part.
But your bill may be telling you something about your building. Understanding what is behind the total is the first step toward deciding what to do about it, and it keeps you from guessing.
Consumption vs. Demand: kWh and kW
Many commercial bills have two distinct components, and they measure different things.
Consumption (kWh)
Consumption is the total amount of energy used over the billing period, measured in kilowatt-hours (kWh). Think of it as the total distance driven on a trip.
Lighting that runs longer than needed, equipment left on overnight, and inefficient systems all show up here.
Demand (kW)
Demand measures how much power the building draws at a given moment, in kilowatts (kW). Think of it as the highest speed reached during the trip.
Utilities size their equipment and capacity to serve peak loads, so many rate schedules charge commercial customers based on the highest demand recorded during a billing period, often measured over a short interval such as 15 minutes. The specifics vary by utility.
Why demand spikes cost more than owners expect
A single short peak can set the demand charge for the entire billing period. Some rate schedules also carry that peak forward into later months, so check whether yours does.
Here is an illustration, not a real rate: imagine a building that runs comfortably most of the month, but one morning every large piece of equipment starts at once. For a brief window, the building sets a new monthly peak. Even if the rest of the month is calm, the demand charge reflects that one moment.
This is why two buildings with similar consumption can have very different bills. It is also why demand is often more manageable than owners expect, because many peaks come from avoidable overlap rather than real need.
Rate Schedules and Time-of-Use Concepts
Your bill will reference a rate schedule, which is the set of rules that determines how you are charged. Look for:
– Whether charges are flat, tiered, or time-of-use. Time-of-use rates charge different prices at different times of day or season.
– Whether there is a separate demand charge, and how it is calculated.
– Seasonal differences, such as summer and winter pricing.
– Fixed customer charges, riders, taxes, and delivery charges that are separate from the energy itself.
Because utilities vary widely, ask yours which schedule your account is on and whether another may fit your usage pattern better. Do not assume you are on the best option simply because you were placed on it years ago.
How to Read 12 to 24 Months of History
A single bill is a snapshot. A year or two of bills is a story.
Gather 12 to 24 months of bills, ideally for each meter, and lay them side by side. Then look at:
– Consumption (kWh) month over month
– Peak demand (kW) month over month
– Total cost and cost per kWh
– Weather patterns, tenant changes, or renovations that may explain differences
Comparing the same month across two years is especially helpful, because it removes some seasonality and shows whether something has truly shifted.
If you manage multiple meters, check that each is assigned to the right space and tenant. Mismatches happen, and they affect both billing and decisions.
Red Flags Worth Investigating
These patterns do not always mean there is a problem, but they are good reasons to ask questions.
High overnight baseload
If you have access to interval data, look at usage when the building is closed. A building that is mostly empty at night should use noticeably less than it does at noon.
A high overnight baseload can point to equipment running on the wrong schedule, lighting left on, overrides that were never released, or systems that never fully turn down.
Seasonal anomalies
Heating and cooling should follow the seasons in a way that makes sense. Watch for:
– Cooling use that stays high in cooler months
– Heating-season increases that seem out of proportion to the weather
– Shoulder-season spikes when both heating and cooling may be running at once
These can signal control issues, simultaneous heating and cooling, or equipment that is not operating as intended.
Demand peaks that do not match the building’s needs
If peak kW is high but the building is not especially busy that day, look at equipment start-up timing and how loads overlap.
Unexplained changes
A step change in usage that is not explained by weather or occupancy deserves attention. It may be a new load, a failing component, or a schedule change.
What to Do Next
You do not need to solve everything at once. A practical path looks like this:
- Assess. Gather your bills and read them with the framework above.
- Benchmark. ENERGY STAR Portfolio Manager is EPA’s free online benchmarking tool, and it helps you understand where your building stands. ENERGY STAR program management is transitioning from EPA to DOE, with Portfolio Manager remaining available throughout the transition. Many cities and states also have benchmarking or building performance requirements, so it is worth checking what applies in your area.
- Start with controls. Review schedules, setpoints, overrides, and equipment start-up sequences. These are often the most accessible places to reduce both consumption and demand.
- Request interval data. Ask your utility whether it is available, since it makes patterns visible.
- Consider an energy assessment. A walk-through can connect what the bill shows to what is happening in the building.
- Plan and phase. Prioritize improvements by impact and cost, and measure the results.
Why this matters financially: operating savings can improve net operating income and, over time, property value. As an illustration only, $10,000 in annual operating savings at a 7% cap rate implies roughly $143,000 in value. Your actual numbers will depend on your property and market.
Where to Go From Here
You do not have to become a utility analyst to benefit from reading your bills. You just need to know what to look for and when to ask for help.
The complimentary Sustainable Property ROI Audit Kit is a practical way to start organizing what you know about your property and where to look next: https://pages.clearbluecommercial.com/audit-request
If you would like to talk through your bills or your property, contact Carolyn at carolyn@clearbluecommercial.com.